
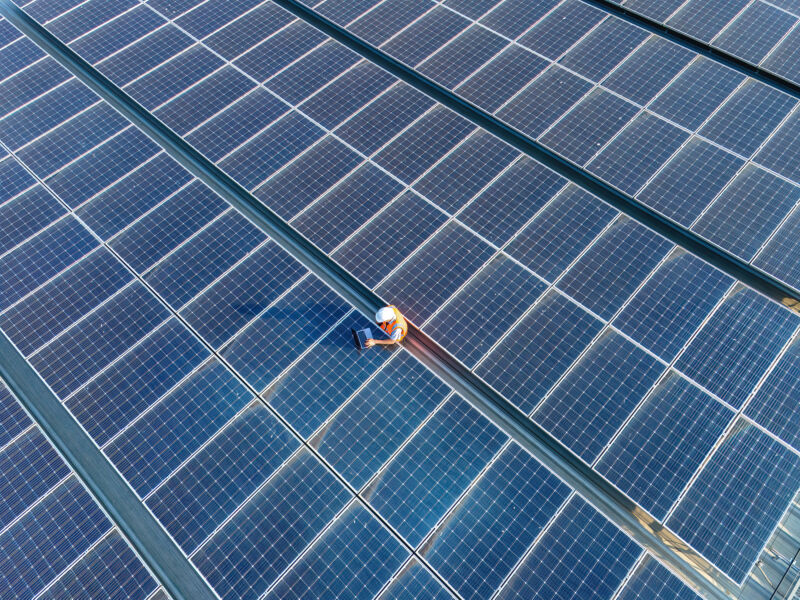
With the plunging price of photovoltaics, the construction of solar plants has boomed in the US. Last year, for example, the US’s Energy Information Agency expected that over half of the new generating capacity would be solar, with a lot of it coming online at the very end of the year for tax reasons. Yesterday, the EIA released electricity generation numbers for the first five months of 2024, and that construction boom has seemingly made itself felt: generation by solar power has shot up by 25 percent compared to just one year earlier.
The EIA breaks down solar production according to the size of the plant. Large grid-scale facilities have their production tracked, giving the EIA hard numbers. For smaller installations, like rooftop solar on residential and commercial buildings, the agency has to estimate the amount produced, since the hardware often resides behind the metering equipment, so only shows up via lower-than-expected consumption.
In terms of utility-scale production, the first five months of 2024 saw it rise by 29 percent compared to the same period in the year prior. Small-scale solar was “only” up by 18 percent, with the combined number rising by 25.3 percent.
Most other generating sources were largely flat, year over year. This includes coal, nuclear, and hydroelectric, all of which changed by 2 percent or less. Wind was up by 4 percent, while natural gas rose by 5 percent. Because natural gas is the largest single source of energy on the grid, however, its 5 percent rise represents a lot of electrons—slightly more than the total increase in wind and solar.
John Timmer
Overall, energy use was up by about 4 percent compared to the same period in 2023. This could simply be a matter of changing weather conditions that require more heating or cooling. But there have been several trends that should increase electricity usage: the rise of bitcoin mining, the growth of data centers, and the electrification of appliances and transport. So far, that hasn’t shown up in the actual electricity usage in the US, which has stayed largely flat for decades. It could be possible that 2024 is the year when usage starts going up again.
More to come
It’s worth noting that this data all comes from before some of the most productive months of the year for solar power; overall, the EIA is predicting that solar production could rise by as much as 42 percent in 2024.
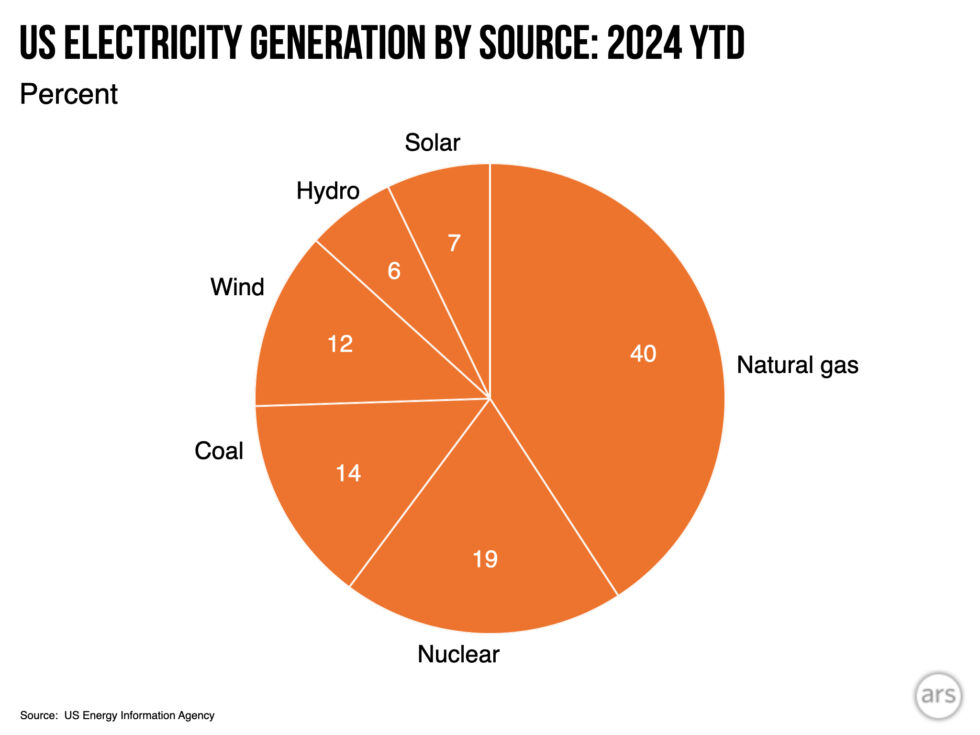
So, where does this leave the US’s efforts to decarbonize? If we combine nuclear, hydro, wind, and solar under the umbrella of carbon-free power sources, then these account for about 45 percent of US electricity production so far this year. Within that category, wind and solar now produce more than three times hydroelectric, and roughly the same amount as nuclear.
Wind and solar have also produced 1.3 times as much electricity as coal so far in 2024, with solar alone now producing about half as much as coal. That said, natural gas still produces twice as much electricity as wind and solar combined, indicating we still have a long way to go to decarbonize our grid.
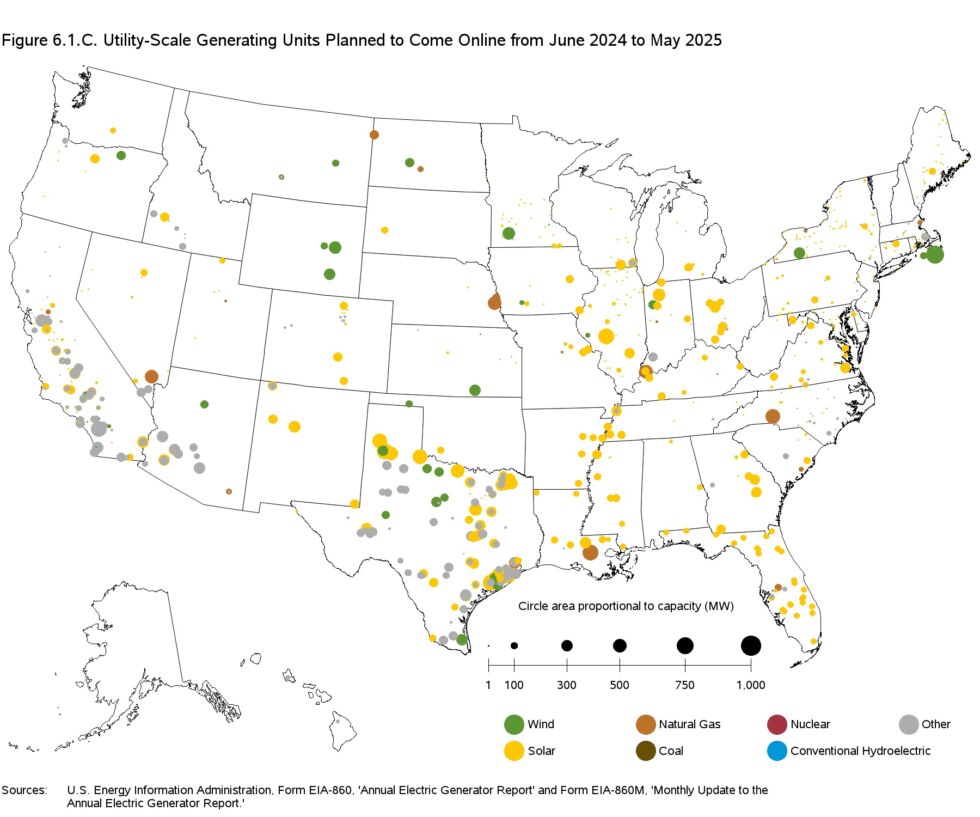
Still, we can expect solar’s productivity to climb even before the year is out. That’s in part because we don’t yet have numbers for June, the month that contains the longest day of the year. But it’s also because the construction boom shows no sign of stopping. As noted here, solar and wind deployments are expected to dwarf everything else over the coming year. The items in gray on the map primarily represent battery storage, which will allow us to make better use of those renewables, as well.
By contrast, facilities that are scheduled for retirement over the next year largely consist of coal and natural gas plants.