In a recent update, Shiba Inu developer Kaal Dhairya (@kaaldhairya), confirmed that a temporary outage affecting the Shibarium network has been resolved. The outage, triggered by networking issues among validators, briefly disrupted services within the Shiba Inu ecosystem, specifically the layer-2 blockchain solution, Shibarium.
Kaal detailed the cause and the subsequent resolution of the problem, stating, “There was a temporary Shibarium outage caused because of networking issues amongst the validators. Network is back up and running now.” He also noted that while the primary network functionality has been restored, some ancillary services such as Shibariumscan or external Remote Procedure Calls (RPCs) may continue to face disruptions until additional remedial steps are completed.
Kaal emphasized the importance of collaboration among infrastructure teams to enhance communication and streamline operations. He urged external teams working on infrastructure-level elements such as RPC to coordinate closely with the Shibarium team. “If you’re an external team working on infrastructure level for Shibarium (e.g., RPC, etc.), please reach out so that we can streamline comms with you over shared telegram / slack channels,” he said.
There was a temporary shibarium outage caused because of networking issues amongst the validators. Network is back up and running now, some services like shibariumscan or external RPCs can still remain down until the steps provided are implemented. If you’re an external team…
— Kaal (@kaaldhairya) April 22, 2024
Shiba Inu Price Unfaced
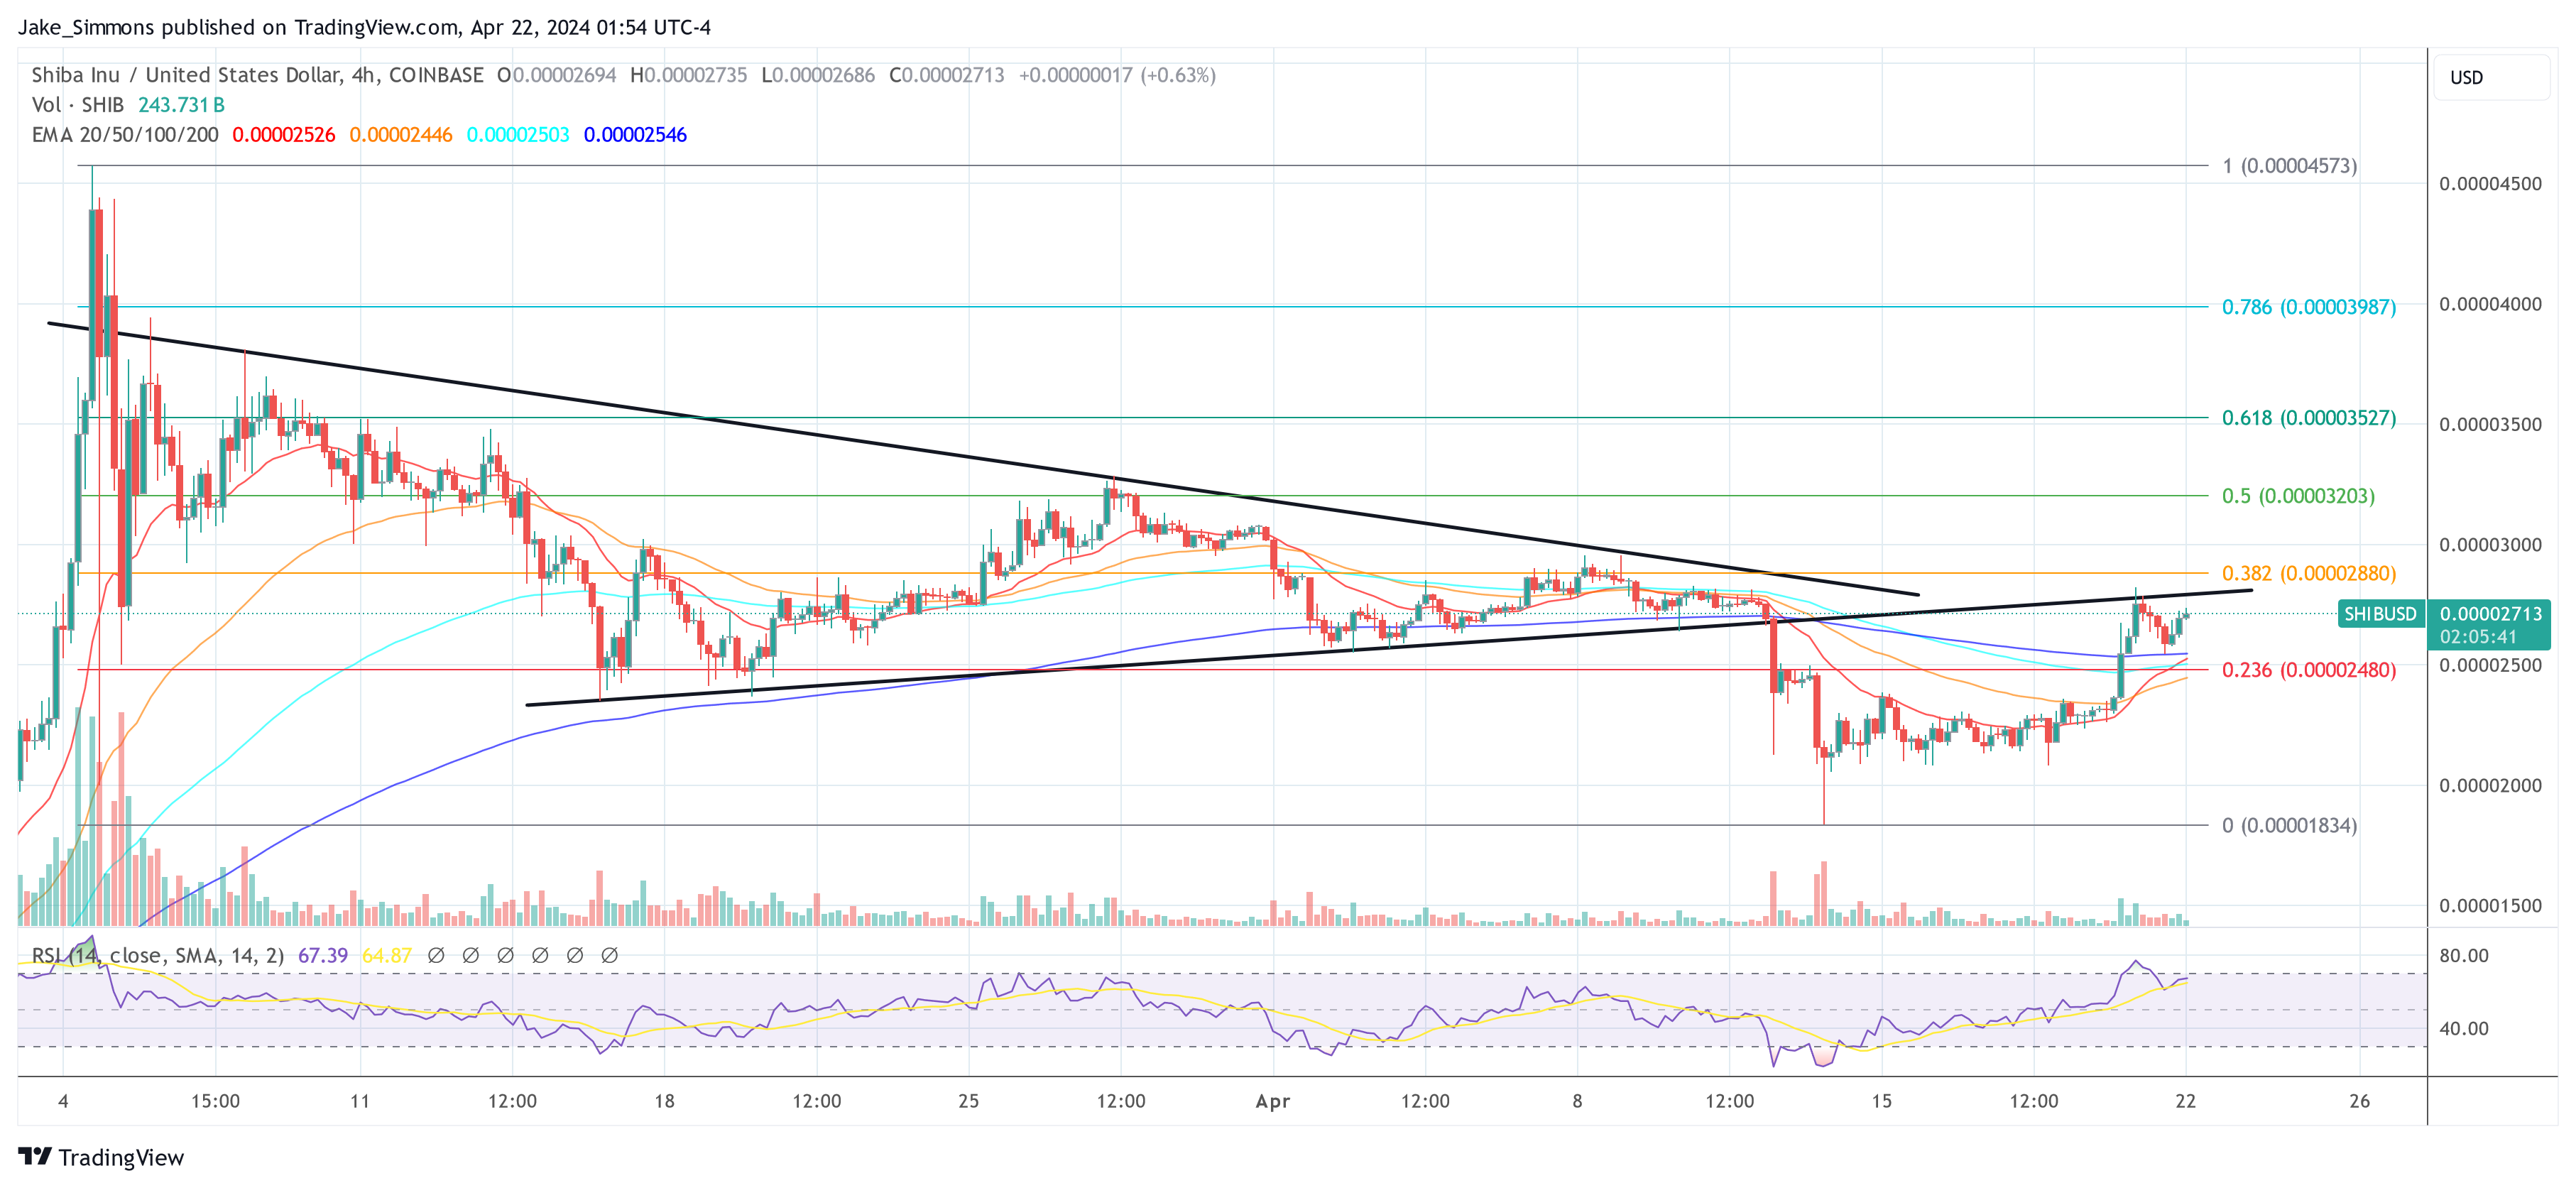
The recent price movements of Shiba Inu (SHIB) show no impact of the Shibarium outage. The four-hour chart for SHIB/USD illustrates a symmetrical triangle pattern that has governed the asset’s movement over the past several weeks.
Contrary to a direct bullish sentiment, the price initially broke to the downside of the triangle on April 12, which typically signals a looming downtrend. However, in a swift change of fortunes, SHIB found substantial support at the 100-day EMA and is now testing the extended lower trendline of the once-confining triangle.

At present, the price has surpassed the crucial resistance-turned-support level marked by the 0.236 Fibonacci retracement level at $0.00002472. Notably, SHIB is also trading above all EMA’s in the 4-hour chart. The 200 EMA (blue line) is currently serving as crucial support after the first attempt to break above the extended trendline (black) failed.
A decisive and sustained break above this level could invalidate the prior bearish breakout, positioning SHIB for a potential bullish move to the north. However, volume activity on the chart indicates a tempered trading environment, lacking the aggressive spikes typically associated with decisive breakouts.
This could suggest that the market is in a state of contemplation, with traders awaiting further confirmation before committing to a clear directional bias. Lastly, the RSI sits at a reading of 67, which is just shy of the overbought threshold. This placement implies that there is room for upward movement before the market becomes overextended.
If SHIB battles above the extended lower trendline, the case for an imminent surge grows stronger, potentially leading to a rally towards the Fibonacci levels of 0.382 ($0.00002867), 0.5 ($0.00003203) and 0.618 ($0.00003527).
Featured image created with DALL·E, chart from TradingView.com
Disclaimer: The article is provided for educational purposes only. It does not represent the opinions of NewsBTC on whether to buy, sell or hold any investments and naturally investing carries risks. You are advised to conduct your own research before making any investment decisions. Use information provided on this website entirely at your own risk.
