Recent analytical insights from FireCharts 2.0 are indicating significant maneuvers by major stakeholders of Bitcoin—often referred to as “whales”—which are impacting the cryptocurrency’s price movements. These stakeholders are altering liquidity patterns in a manner that suggests a strategic push towards a more tightly controlled trading range.
What Bitcoin Whales Are Up To
According to Material Indicators, an advanced trading analytics, there has been a noticeable adjustment in the distribution of liquidity within Bitcoin’s order book. Specifically, there is a decrease in ask liquidity at higher price points, coupled with an increase in bid liquidity starting from $60,000 to $67,000. This dynamic is set to compress Bitcoin’s price into a narrower range, a scenario anticipated by the platform since the digital asset escalated above $52,000.
The discussions about Bitcoin’s price trajectory have been rife with speculation about a potential pump to $73,000, especially following its bounce from a low of $52,000. Despite a recent high near $70,600, which ended in a sharp rejection, the sentiment remains cautiously optimistic. “There has been a lot of chatter since late last week calling for a pump to $73k, and there are legitimate reasons why that is a near term target, and why it is still possible despite the rejection from $70.6k we saw on Monday,” noted Material Indicators.
Related Reading
From a macroeconomic perspective, Bitcoin’s prospects appear exceedingly bullish. “The outlook for Bitcoin is literally as bullish as it’s ever been,” said a representative from Material Indicators during a recent livestream. They refrained from reiterating the specifics, urging viewers to revisit the previous week’s analysis for a deeper understanding.
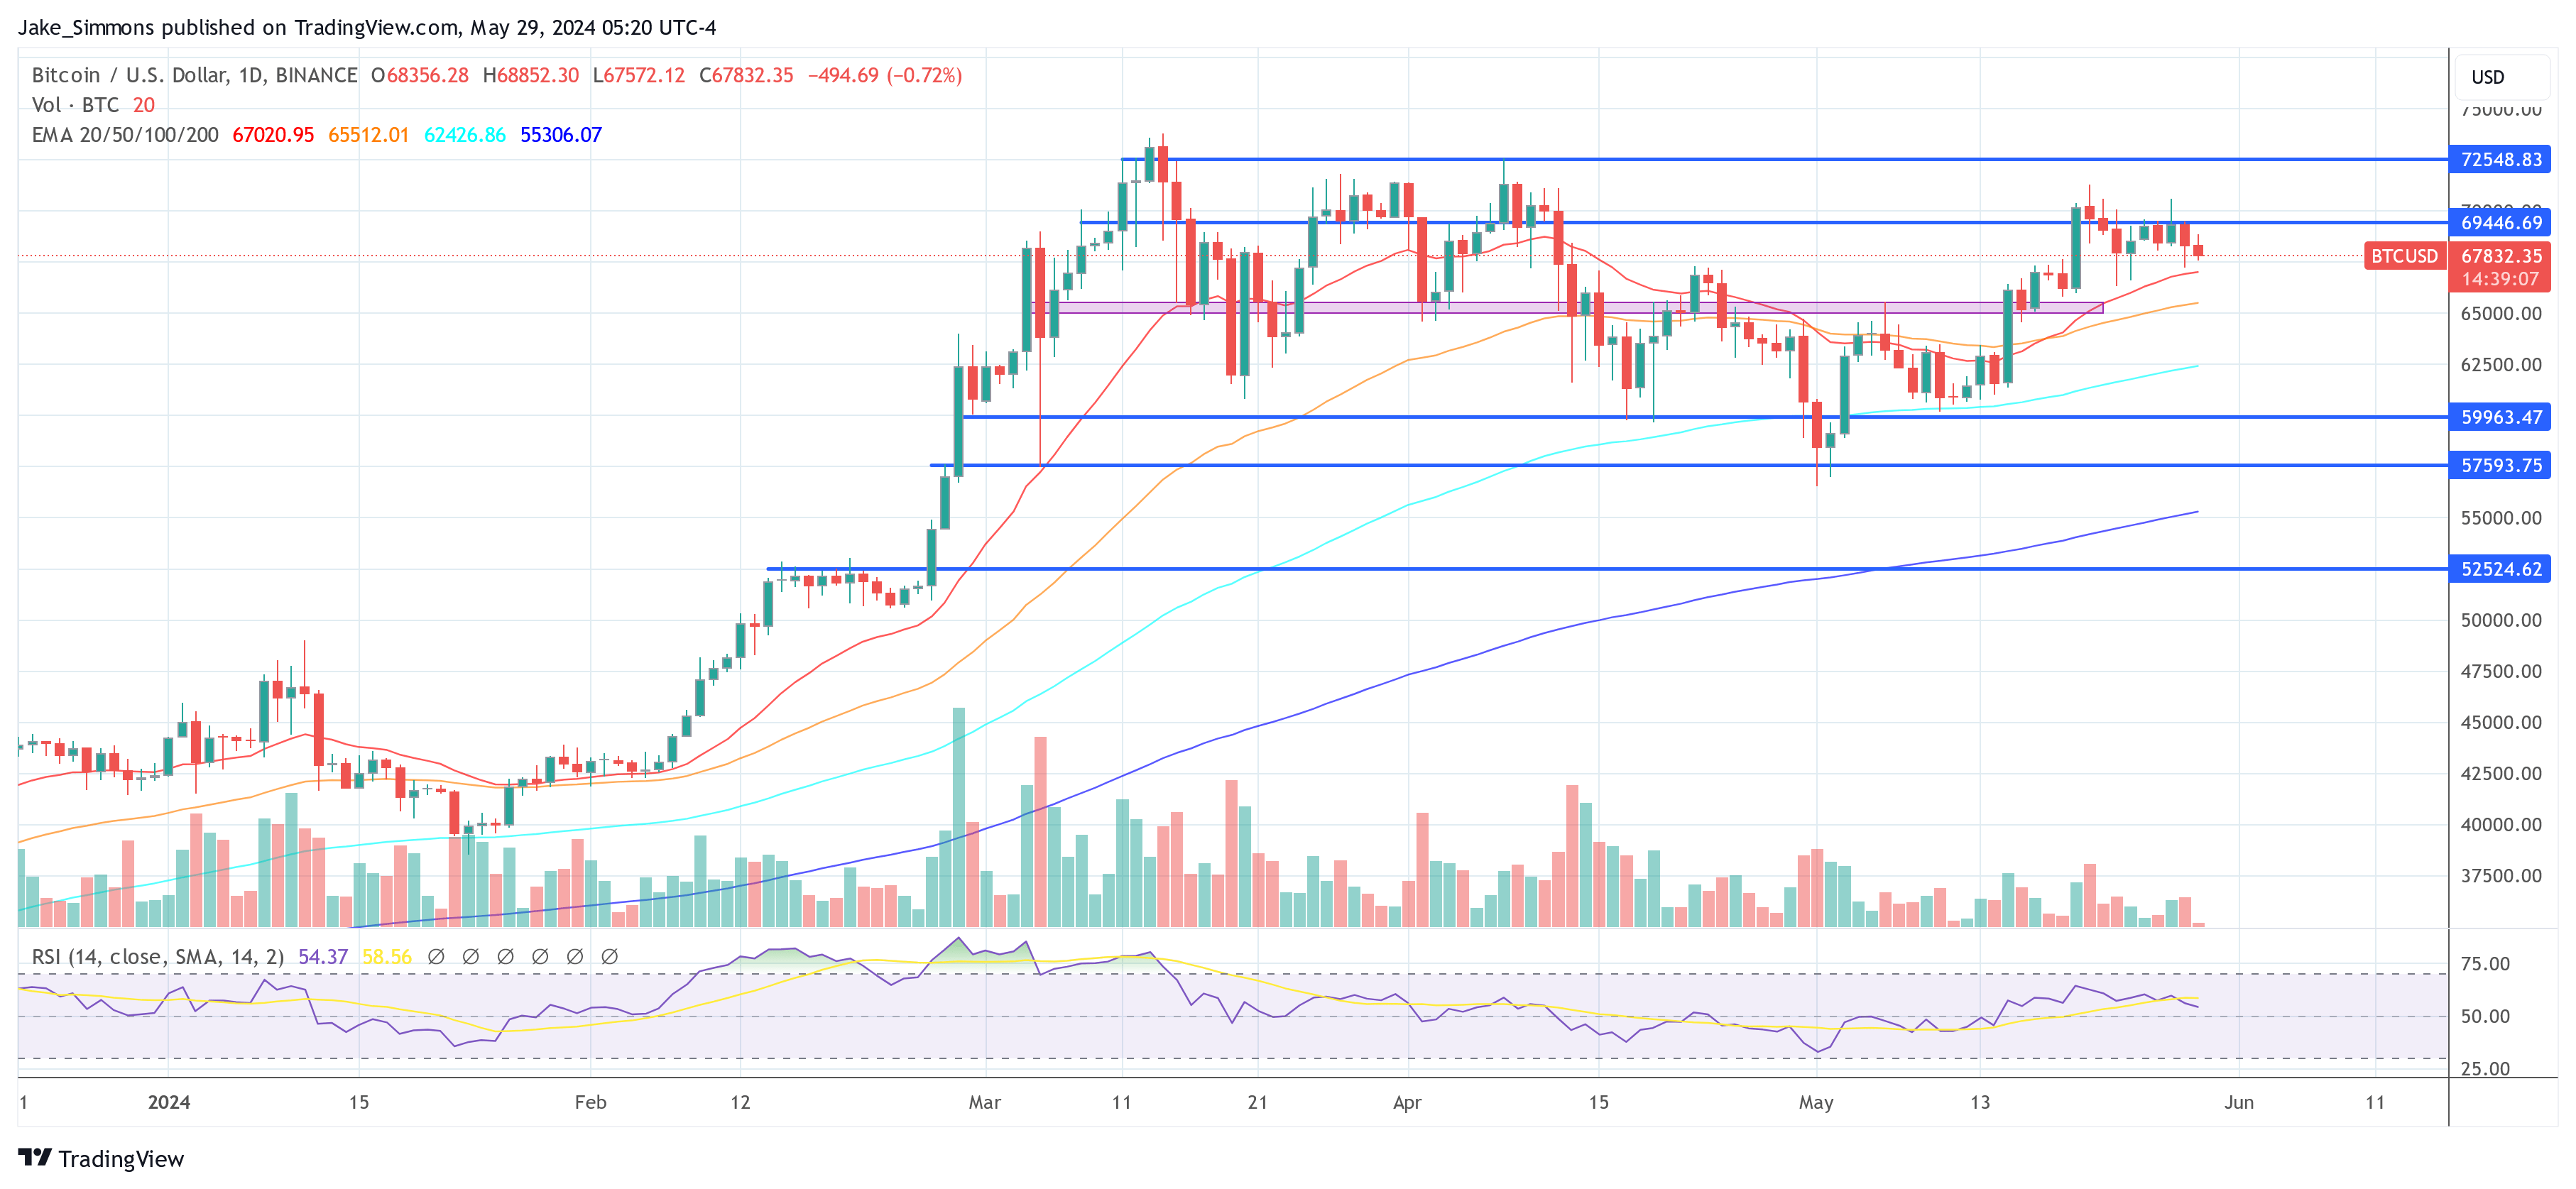
In contrast, the technical analysis paints a more nuanced picture. Despite the favorable macro outlook, Bitcoin has continuously failed to confirm a resistance/support (R/S) flip at $69,000—a crucial level for confirming bullish momentum. This ongoing failure is emblematic of the bulls’ struggle to maintain upward pressure and secure a new all-time high (ATH). By integrating order book data with technical indicators, analysts have observed a progressive downward movement in blocks of ask liquidity, from initial placements around $75,000-$76,000 to recent figures near $70,000-$71,500.
Looking forward, the pivotal question is: how low can Bitcoin realistically go before finding substantial support? To address this, analysts at Material Indicators turn to a combination of technical analysis and real-time order book data. The convergence of Bitcoin’s 21-Day, 50-Day, and 100-Day Moving Averages around $65,000-$66,000 offers a compelling case for potential support. The 21-Day MA, in particular, is favored for its historical reliability as both resistance and support.
Related Reading
Order book data corroborates this analysis, showing a strengthening of ask liquidity resistance above $70,000, while bid liquidity is strategically placed down to as low as $58,000. The largest concentrations of bid liquidity indicate the strongest support at $60,000 and $65,000, with somewhat lesser support around $66,000 and $67,000.
Despite the complex interplay of factors in the near term, the long-term perspective remains overwhelmingly bullish. The essential query for the market is when, not if, a legitimate breakout will take place. Observations from the order book show more than $200 million in asks stacked from $71,000 to $75,000, juxtaposed with around $90 million in bids between $65,000 and $67,000. If ask liquidity does not thin out, bid liquidity will need to strengthen significantly to trigger a sustainable break into the $70s.
According to Material Indicators, the most favorable scenario would see Bitcoin establish a firm consolidation range above $65,000, validate an R/S Flip at $69,000, and stabilize above this level before aiming for a new ATH. Such a development would not only confirm the bullish trend but also pave the way for sustained upward momentum based on the current order book trends and technical analyses. This trajectory, they suggest, would provide the healthiest market progression in light of the existing conditions.
At press time, BTC traded at $67,832.

Featured image created with DALL·E, chart from TradingView.com
